Post Week 13 College Football Rankings

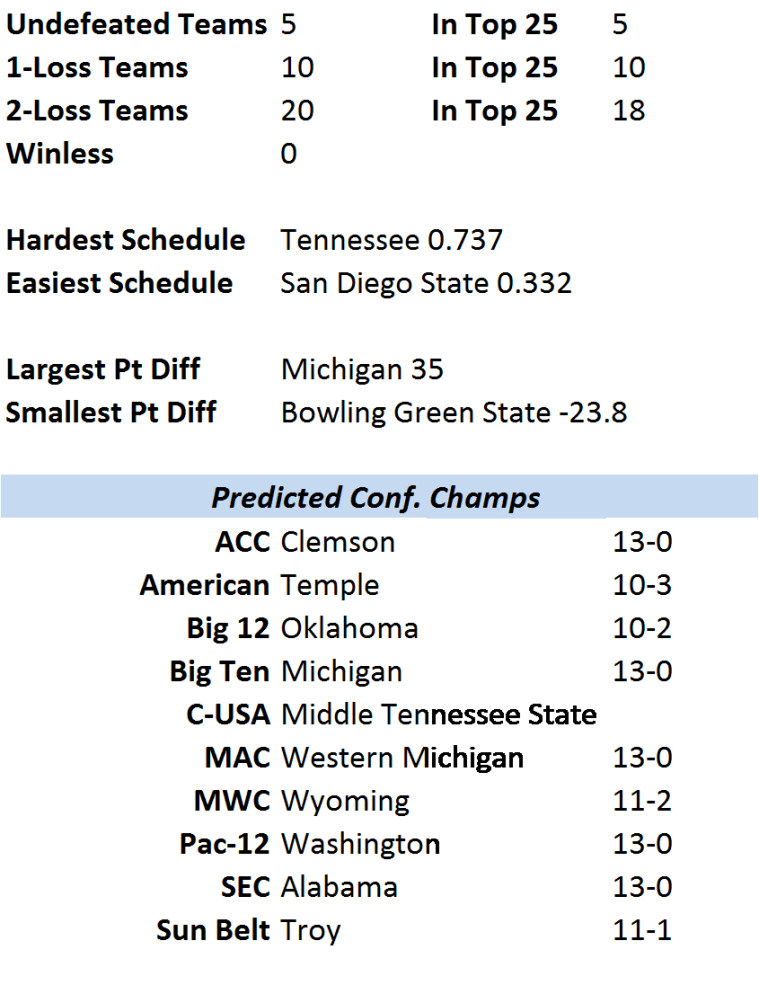
It’s Bama and everyone else. Maybe it’s always been that way and we’ve just never admitted it until now. Bama ranks #1 in the Post Week 13 College Football rankings and they’re showing no signs of letting up from here to trophy presentation time. Not even an SEC championship game–against a Florida team which took advantage of a mis-led Tiger team in Death Valley this past Saturday to clinch to SEC East–seems to be capable of derailing the Tide from grabbing their billionth football championship. yay them.


top-25-rankings

Ohio State and Michigan are beating folks up fairly regularly. Other than missteps against Iowa and Penn State, the residents of the Horseshoe and Big House have been outscoring opponents by 30 and 31 points per game, respectively. Is it possible that either of them have a shot at taking down Bama? It’s hard to imagine, but in a world where life is stranger than fiction, who really knows?!? Ohio State needs Penn State–the Buckeyes’ only defeat this year–to slip up this coming weekend against Michigan State in order to get to the Big Ten title match, presumably against #9 Wisconsin. Should they make it to the Big Ten title game, they’d be a shoe-in to make the CFB Playoffs. Should Michigan win, and thus make the Big Ten title game and assuming they win there, they’d take the #2 spot in the CFB Playoffs. Aside from those options, the rest of the playoff field is a crap shoot.

Outside of the Big Ten’s multitude of scenarios for crowning a champion, the remaining two spots of the CFB playoff should include some combination of the following teams: Clemson, Louisville and Washington.

Clemson will face either North Carolina or Virginia Tech in the ACC championship. Should they take the conference crown, they’re pretty much guaranteed a spot amongst the final four.

Washington is one win away from heading to the Pac-12 title game–presumably against Colorado–and could steal the final spot in the playoffs with a strong win against rival Washington State this coming weekend and a Pac-12 crown. Should the Huskies falter on either step it would directly benefit Louisville as a possible second entry from the ACC.

conference-rankings

Conference Rankings

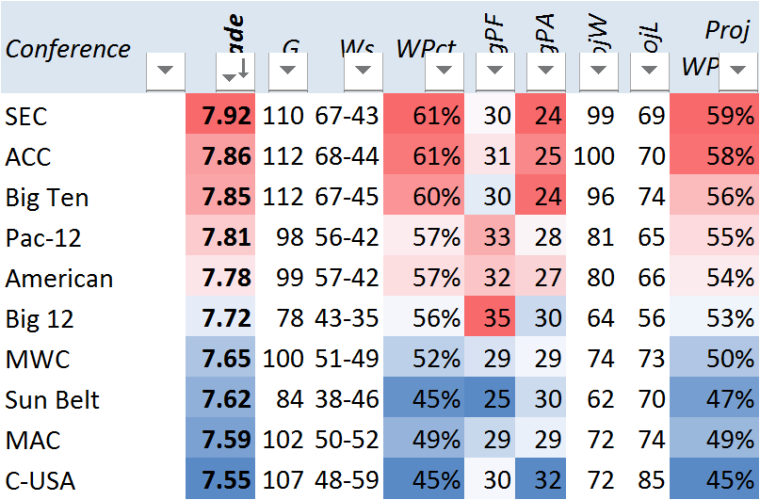
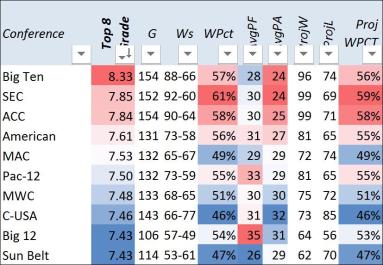
The Big Ten has taken over the conference rankings lead from the SEC in what has been a very, very long run for the football powerhouse.

With 4 teams in the top 9, the Big Ten reins supreme as the strongest conference in the FBS in 2016. Though the SEC holds the top spot in the Top 25 rankings with Alabama sitting atop their regular perch, the rest of the league has faltered in highly ranked teams. After Bama, Auburn and Florida come in at 13th and 15th, respectively, while the former will represents half of the league in the conference championship game.
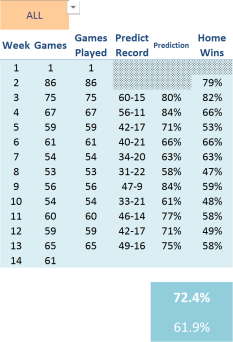
Pick’Em Accuracy

The Bassford College Football Matrix has had a good year picking games. It has tallied a 72.4% accuracy so far in 2016 while home teams have averaged winning percentage of 61.9%.

projection-marks

Week 11 College Football Rankings

Alabama holds the top spot at 8-0 heading into their Week 11 tilt with LSU in Baton Rouge. The Tide have, for weeks now, looked like the class of the college football landscape but can the Tide “hold that Tiger” in a feisty Death Valley this Saturday?

cfb-rankings-after-11

#7 Auburn, who is a game behind Bama and already holding a head-t0-head victory over LSU is hoping for a huge upset in Baton Rouge. The Tigers held off Ole Miss this weekend to keep their SEC West title hopes alive.

#2 Clemson also held off a similarly hard-charging Florida State team beating the Seminoles in their own Death Valley this past Saturday to maintain their undefeated record.

Perhaps the biggest surprise(s) amongst the top 25 this week is the emergence of mid-major and #10 Western Michigan as well as 6-1 and #11 Troy. Those two teams are ranked higher than midway up the rankings by result of their high-ish margin of victory tally (WMU at 25.1 and Troy at 17.7). Both would be ranked higher if it weren’t for their unsurprisingly low SOS marks–both are lower than 50% for their opponents’ marks.

WMU is leading the MAC at 8-0 and likewise undefeated in conference games while Troy’s only loss came against #2  Clemson earlier this year.

conf-standings-after-11-cfb

The SEC holds the top spot amongst conferences in the Bassford Power Index. The ACC comes up just behind their southeastern counterparts with two teams in the top 10, Clemson and Louisville.

One mid-major ranks higher than a Power 5 conference as The American conference–with two top 25 teams in Houston and Temple–leads the Big 12 by a small margin. The Big 12 doesn’t have a single team in the top 10 and their top ranked team from last week, West Virginia, dropped a critical game this weekend lowering their ranking down to 22nd this week.

notables-cfb-after-11

The below is a compiled record tally for the Bassford College Football Matrix rankings throughout the 2016 season. The final column on the right records the overall FBS record for home teams by respective week of the season.

predictions-cfb-2016-after-11


2016 Projected Wins: NCAA FBS Edition

Another friend sent me a message this past week in response to my last article. He noted that the same regressions could possibly be deciphered for college athletics if there were only a way to monetize a salary. Since “students don’t receive payment to attend a particular university”, I had to find another salary. This led me to research head coach salaries for FBS schools.

Luckily, I was able to find data for this year and the last three years’—thanks mostly to USA Today’s Coaches Salary Database—worth of data. I then took that data and arranged it alongside the wins, winning percentages and SRS numbers for each team. (SRS data supplied by www.sports-reference.com/cfb)

Once I had everything sorted out and aligned, I was then able to run some correlation tests on each of the sets of data and found some interesting things.

  1. SRS data—because football-reference.com is so amazing—has an 87.4 percent correlation with win percentage.
  2. Head Coach Compensation only has about a 41.5 percent correlation with winning percentage. It is also more negatively correlated to points allowed than it is to points scored. Maybe this means that money can only buy good defense, on average?
  3. Compensation has a 68 percent correlation with SRS. This was significant, and seeing as SRS had a high correlation with WPCT, I decided that I could use this route Compensation–>SRS Rating–>Win Percentage. That made the computations much simpler.
  4. Seeing that the correlation with compensation was still lower than, say, a more acceptable rate of 85 percent, I decided to add in a trend factor. When running a regression for trend on WPCT and Wins I didn’t feel that either correlation rated high enough from year to year. So, I went back to SRS and found that it had an 86.7 correlation rate from year to year SRS.
  5. Once I arrived at projected data for wins and SRS (from both the Compensation and Trend data) I was able to then give a weighted (2:1 Trend) average of each university.
  6. These numbers are based off of current head coach salaries as well as five year trend data for SRS statistics. Not all schools had reported HC salary—mostly the private universities—and for them I took simply the weighted average of the two projected win trends.
  7. The below chart details a “Top 25” of projected wins based on the noted data pools.


Rank School Conf. Weighted

Average

Wins

Projected

Wins

(HC Salary)

Projected

Wins

(Trend)

Projected

SRS

(HC Salary)

Projected

SRS

(Trend)

1 Ohio State Big Ten 12 9 14 10.93 26.69
2 Alabama SEC 12 10 12 14.25 20.93
3 Mississippi SEC 11 9 13 7.71 23.86
4 Stanford Pac 12 11 11 16.38
5 Clemson ACC 11 9 12 7.96 19.82
6 Michigan State Big Ten 11 9 12 8.86 18.63
7 Baylor Big 12 10 10 14.67
8 Florida State ACC 10 9 11 9.48 16.94
9 Texas Christian Big 12 10 10 14.36
10 Mississippi State SEC 10 9 11 7.71 17.27
11 UCLA Pac 12 10 9 11 7.84 17.15
12 Auburn SEC 10 9 11 9.48 15.55
13 Southern California Pac 12 10 10 12.45
14 Oklahoma Big 12 10 9 10 10.85 12.68
15 Tennessee SEC 10 9 10 7.71 13.96
16 Notre Dame Ind. 10 10 11.52
17 Georgia SEC 10 9 10 8.19 13.11
18 Washington Pac 12 10 9 10 8.19 12.86
19 Utah Pac 12 9 8 10 5.75 13.91
20 Oregon Pac 12 9 8 10 3.98 14.34
21 Duke ACC 9 9 10.21
22 Louisville ACC 9 9 9 8.42 11.07
23 Arkansas SEC 9 8 10 7.20 11.64
24 Memphis AAC 9 6 11 -1.72 15.75
25 Louisiana State SEC 9 9 9 10.42 9.14


The below chart is a look at how the SEC would fare this year according to this compiled data.

EAST Weighted

Average

Wins W’s

Projected

Wins

(HC Salary)

Projected

Wins

(Trend)

Projected

SRS

(HC Salary)

Projected

SRS

(Trend)

Tennessee 10 9 10 7.71 13.96
Georgia 10 9 10 8.19 13.11
Florida 9 9 9 8.42 8.58
Missouri 8 9 8 7.84 5.18
South Carolina 7 9 6 9.48 -2.20
Kentucky 7 8 6 4.92 -2.02
Vanderbilt 4 4 -7.52
WEST Weighted

Average

Wins W’s

Projected

Wins

(HC Salary)

Projected

Wins

(Trend)

Projected

SRS

(HC Salary)

Projected

SRS

(Trend)

Alabama 12 10 12 14.25 20.93
Mississippi 11 9 13 7.71 23.86
Mississippi State 10 9 11 7.71 17.27
Auburn 10 9 11 9.48 15.55
Arkansas 9 8 10 7.20 11.64
Louisiana State 9 9 9 10.42 9.14
Texas A&M 9 10 9 11.25 7.83


Professional Sports Salaries and Fan Expectations

The other day a good friend sent me a link for an article about the LA Dodgers, Moneyball and how the tactful art of underspending may not be the most effective way of building a title contender.

While the points espoused in the article fall short of becoming gospel, it was successful in getting my statistical juices flowing. The article’s main theme, crudely stated, was essentially: more average money = more average wins. In baseball which has no hard salary cap, the potential exists for large pocketed clubs to overspend and create “stacked” programs, as do teams like the Yankees and Red Sox. In other sports, such as football and basketball, there are more concrete caps on spending.

Continue reading “Professional Sports Salaries and Fan Expectations”